Financial independence, made reachable.
ReachABLE is a public financial platform for people with disabilities. Free, private, and built on rigorous research.
What ReachABLE is.
Professor Michelle Yin founded ReachABLE to help people with disabilities reach financial independence. ReachABLE is a place where people can learn about finance, economics, and benefits, and get everything they need to build wealth in support of their education, career, family, and life goals.
Every tool on this site is free. Every course is free. Nothing you type is saved unless you tell us to save it. Built around the questions people actually ask, in plain 8th-grade language. If ReachABLE helps you, a five-dollar donation supports the platform and the team. Donations are optional. All tools stay free whether you donate or not.
What you can do here.
ReachABLE is growing into a full learning and planning platform for financial independence, not just an ABLE tool.
- Check your ABLE eligibility by voice or text, in five minutes.
- Open your ABLE account with guided pre-fill for your state portal.
- Learn about benefits. SSI, SSDI, Medicaid, HCBS, SNAP, LIHEAP, and how they interact with saving and working.
- Take free courses on personal finance, economics of disability programs, and the rules that govern your benefits.
- Get schooling and college counseling for students with disabilities and their families, including transition planning, aid, and disability-services navigation.
- Get personalized plans for wealth building, retirement, homeownership, and debt reduction, all designed so you keep the benefits you rely on.
- Support family goals through Special Needs Trust and 529 coordination.
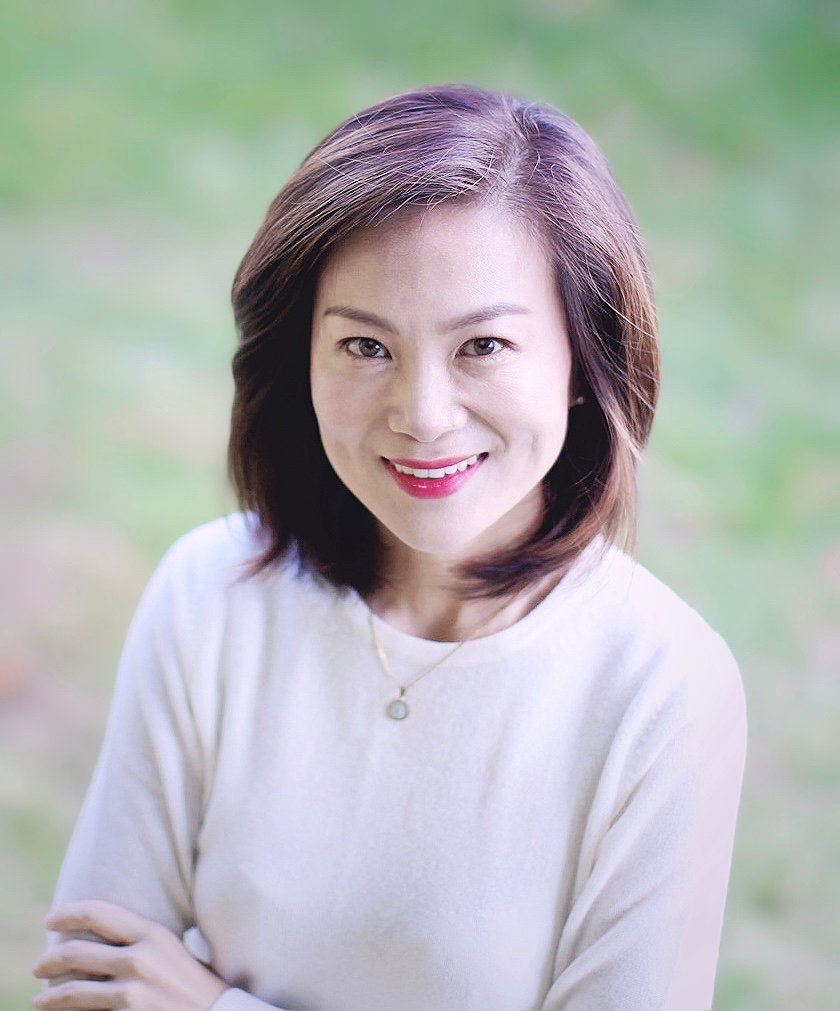
Professor Michelle Yin
Applied microeconomist studying disability-margin labor markets, the ABLE Act, and financial inclusion. Professor Yin founded ReachABLE, informed by her research, to move findings from journal articles into a tool families can actually use. The platform was developed before the award of Project ReachABLE, a federally funded initiative administered by Northwestern University with support from the Administration for Community Living, U.S. Department of Health and Human Services. The grant supports ABLE outreach and enrollment, with Professor Yin as Principal Investigator; it does not fund building the platform, which Professor Yin owns, and it can help validate and tailor services for the pilot states. The arrangements governing the platform's use and further development under the project are being established. ReachABLE provides educational information and is not a government-operated ABLE enrollment service.

Technical partner.
Inclusive AI Institute provides the technical lead and support for the ReachABLE platform, including the voice-first interaction layer, the accessibility production pipeline, and the plain-language content engine. Their team ensures every feature meets accessibility standards from the first line of code.
Selected research.
ReachABLE tools are informed by Professor Yin's ongoing research on ABLE and disability financial inclusion. The research is separate from ReachABLE. Below is the research most directly relevant to ReachABLE. For the full portfolio (disability labor markets, minimum wage and health, AI and workforce, VR programs, and more), visit the lab.
Yin (2026) — ABLE working paper
First causal-identification study of the ABLE Act. Staggered difference-in-differences on state ABLE program launches, 2016 to 2026. Effects on disposable income, employment, wage income, and disability-insurance rolls.
Disability labor markets research
Ongoing lab work on employment, earnings, and benefits interactions for adults with disabilities. Includes minimum wage effects, vocational rehabilitation program outcomes, and AI exposure measurement.
Age Adjustment Act analysis
Projected population and fiscal effects of raising the ABLE age-of-onset threshold from 26 to 46, effective January 2026. About six million additional adults become eligible.
One-page briefs.
Short briefs written for specific audiences. Each is one page and covers what that audience needs to know. Open to read online, or print for offline sharing.
Contact.
Founding PI: Dr. Michelle Yin
Lab email: info@joinreachable.com
Lab website: riseilab.org
PI website: michelleyin.org
General: info@joinreachable.com
Partnerships: info@joinreachable.com
Employers: info@joinreachable.com
Privacy: info@joinreachable.com
Trust and vendor review: info@joinreachable.com